Toronto Real Estate Sales C04
               
               
                North Toronto Houses - 2015 1st Quarter Report C04


                 Including: Bedford Park, Forest Hill North, Lawrence Park and Englemount


               Detached Houses


                  | 
                 
                  
                   North Toronto
                  
                  | 
                 
                  | 
                 
                  
                   2015
                  
                  | 
                 
                  | 
                 
                  | 
                 
                  
                   2014
                  
                  | 
                 
                  | 
                 
                  
                   Difference
                  
                  | 
                
                
                 | 
                  
                   House Sales
                  
                  | 
                 
                  | 
                 
                  
                   157
                  
                  | 
                 
                  | 
                 
                  | 
                 
                  
                   148
                  
                  | 
                 
                  | 
                 
                  
                   + 6.1%
                  
                  | 
                
                
                 | 
                  
                   Homes Average Price
                  
                  | 
                 
                  | 
                 
                  
                   $1,688,333
                  
                  | 
                 
                  | 
                 
                  | 
                 
                  
                   $1,486,912
                  
                  | 
                 
                  | 
                 
                  
                   + 13.5%
                  
                  | 
                
                
                 | 
                  
                   New Listings
                  
                  | 
                 
                  | 
                 
                  
                   301
                  
                  | 
                 
                  | 
                 
                  | 
                 
                  
                   338
                  
                  | 
                 
                  | 
                 
                  
                   - 10.9%
                  
                  | 
                
                
                 | 
                  
                   Active Listings
                  
                  | 
                 
                  | 
                 
                  
                   322
                  
                  | 
                 
                  | 
                 
                  | 
                 
                  
                   422
                  
                  | 
                 
                  | 
                 
                  
                   - 23.7%
                  
                  | 
                
                
                 | 
                  
                   % of Sales Price to Listing Price
                  
                  | 
                 
                  | 
                 
                  
                   101.7%
                  
                  | 
                 
                  | 
                 
                  | 
                 
                  
                   100.3%
                  
                  | 
                 
                  | 
                 
                  
                   + 1.4%
                  
                  | 
                
                
                 | 
                  
                   Days on Market
                  
                  | 
                 
                  | 
                 
                  
                   16
                  
                  | 
                 
                  | 
                 
                  | 
                 
                  
                   17
                  
                  | 
                 
                  | 
                 
                  
                   - 5.9%
                  
                  | 


                 | 
                  | 
                 
                  
                   Sales
                  
                  | 
                 
                  
                   Average Price
                  
                  | 
                 
                  
                   New Listings
                  
                  | 
                 
                  
                   Days on Market
                  
                  | 
                 
                  
                   % Sold Price / List Price
                  
                  | 
                
                
                 | 
                  
                   Bedford Park
                  
                  | 
                 
                  
                   68
                  
                  | 
                 
                  
                   $1,808,449
                  
                  | 
                 
                  
                   155
                  
                  | 
                 
                  
                   17
                  
                  | 
                 
                  
                   100.9%
                  
                  | 
                
                
                 | 
                  
                   Englemount
                  
                  | 
                 
                  
                   8
                  
                  | 
                 
                  
                   $1,289,313
                  
                  | 
                 
                  
                   18
                  
                  | 
                 
                  
                   41
                  
                  | 
                 
                  
                   94.3%
                  
                  | 
                
                
                 | 
                  
                   Forest Hill North
                  
                  | 
                 
                  
                   13
                  
                  | 
                 
                  
                   $1,471,545
                  
                  | 
                 
                  
                   20
                  
                  | 
                 
                  
                   12
                  
                  | 
                 
                  
                   103.8%
                  
                  | 
                
                
                 | 
                  
                   Lawrence Park North
                  
                  | 
                 
                  
                   35
                  
                  | 
                 
                  
                   $1,416,437
                  
                  | 
                 
                  
                   62
                  
                  | 
                 
                  
                   14
                  
                  | 
                 
                  
                   103.4%
                  
                  | 
                
                
                 | 
                  
                   Lawrence Park South
                  
                  | 
                 
                  
                   33
                  
                  | 
                 
                  
                   $1,911,330
                  
                  | 
                 
                  
                   46
                  
                  | 
                 
                  
                   12
                  
                  | 
                 
                  
                   102.7%
                  
                  | 


               Semi-detached Houses


                  | 
                 
                  
                   North Toronto
                  
                  | 
                 
                  | 
                 
                  
                   2015
                  
                  | 
                 
                  | 
                 
                  | 
                 
                  
                   2014
                  
                  | 
                 
                  | 
                 
                  
                   Difference
                  
                  | 
                
                
                 | 
                  
                   House Sales
                  
                  | 
                 
                  | 
                 
                  
                   8
                  
                  | 
                 
                  | 
                 
                  | 
                 
                  
                   8
                  
                  | 
                 
                  | 
                 
                  
                   0.0%
                  
                  | 
                
                
                 | 
                  
                   Homes Average Price
                  
                  | 
                 
                  | 
                 
                  
                   $976,250
                  
                  | 
                 
                  | 
                 
                  | 
                 
                  
                   $1,001,513
                  
                  | 
                 
                  | 
                 
                  
                   - 2.5%
                  
                  | 
                
                
                 | 
                  
                   New Listings
                  
                  | 
                 
                  | 
                 
                  
                   9
                  
                  | 
                 
                  | 
                 
                  | 
                 
                  
                   12
                  
                  | 
                 
                  | 
                 
                  
                   - 25.0%
                  
                  | 
                
                
                 | 
                  
                   Active Listings
                  
                  | 
                 
                  | 
                 
                  
                   2
                  
                  | 
                 
                  | 
                 
                  | 
                 
                  
                   7
                  
                  | 
                 
                  | 
                 
                  
                   - 71.4%
                  
                  | 
                
                
                 | 
                  
                   % of Sales Price to Listing Price
                  
                  | 
                 
                  | 
                 
                  
                   107.1%
                  
                  | 
                 
                  | 
                 
                  | 
                 
                  
                   105.0%
                  
                  | 
                 
                  | 
                 
                  
                   + 2.1%
                  
                  | 
                
                
                 | 
                  
                   Days on Market
                  
                  | 
                 
                  | 
                 
                  
                   9
                  
                  | 
                 
                  | 
                 
                  | 
                 
                  
                   14
                  
                  | 
                 
                  | 
                 
                  
                   - 35.7%
                  
                  | 


                 | 
                  | 
                 
                  
                   Sales
                  
                  | 
                 
                  
                   Average Price
                  
                  | 
                 
                  
                   New Listings
                  
                  | 
                 
                  
                   Days on Market
                  
                  | 
                 
                  <
                  
                   % Sold Price / List Price
                  
                  | 
                
                
                 | 
                  
                   Bedford Park
                  
                  | 
                 
                  
                   1
                  
                  | 
                 
                  
                   $1,410,000
                  
                  | 
                 
                  
                   1
                  
                  | 
                 
                  
                   14
                  
                  | 
                 
                  
                   101.0%
                  
                  | 
                
                
                 | 
                  
                   Lawrence Park North
                  
                  | 
                 
                  
                   7
                  
                  | 
                 
                  
                   $914,286
                  
                  | 
                 
                  
                   8
                  
                  | 
                 
                  
                   8
                  
                  | 
                 
                  
                   108.5%
                  
                  | 
                
                
                 | 
                  
                   Lawrence Park South
                  
                  | 
                 
                  
                   0
                  
                  | 
                 
                  
                   $0
                  
                  | 
                 
                  
                   0
                  
                  | 
                 
                  <
                  
                   0
                  
                  | 
                 
                  
                   0.0%
                  
                  | 


               Attached Houses (Freehold Townhouses)


                  | 
                 
                  
                   North Toronto
                  
                  | 
                 
                  | 
                 
                  
                   2015
                  
                  | 
                 
                  | 
                 
                  | 
                 
                  
                   2014
                  
                  | 
                 
                  | 
                 
                  
                   Difference
                  
                  | 
                
                
                 | 
                  
                   House Sales
                  
                  | 
                 
                  | 
                 
                  
                   4
                  
                  | 
                 
                  | 
                 
                  | 
                 
                  
                   19
                  
                  | 
                 
                  | 
                 
                  
                   - 1.0%
                  
                  | 
                
                
                 | 
                  
                   Homes Average Price
                  
                  | 
                 
                  | 
                 
                  
                   $757,500
                  
                  | 
                 
                  | 
                 
                  | 
                 
                  >
                  
                   $568,477
                  
                  | 
                 
                  | 
                 
                  
                   + 22.3%
                  
                  | 
                
                
                 | 
                  
                   New Listings
                  
                  | 
                 
                  | 
                 
                  
                   26
                  
                  | 
                 
                  | 
                 
                  | 
                 
                  
                   24
                  
                  | 
                 
                  | 
                 
                  
                   + 8.3%
                  
                  | 
                
                
                 | 
                  
                   Active Listings
                  
                  | 
                 
                  | 
                 
                  
                   15
                  
                  | 
                 
                  | 
                 
                  | 
                 
                  
                   14
                  
                  | 
                 
                  | 
                 
                  
                   + 7.1%
                  
                  | 
                
                
                 | 
                  
                   % of Sales Price to Listing Price
                  
                  | 
                 
                  | 
                 
                  
                   98.0%
                  
                  | 
                 
                  | 
                 
                  | 
                 
                  
                   109.4%
                  
                  | 
                 
                  | 
                 
                  
                   - 1.7%
                  
                  | 
                
                
                 | 
                  
                   Days on Market
                  
                  | 
                 
                  | 
                 
                  
                   40
                  
                  | 
                 
                  | 
                 
                  | 
                 
                  
                   11
                  
                  | 
                 
                  | 
                 
                  
                   - 9%
                  
                  | 


                 | 
                  | 
                 
                  
                   Sales
                  
                  | 
                 
                  
                   Average Price
                  
                  | 
                 
                  
                   New Listings
                  
                  | 
                 
                  
                   Days on Market
                  
                  | 
                 
                  
                   % Sold Price / List Price
                  
                  | 
                
                
                 | 
                  
                   Bedford Park
                  
                  | 
                 
                  
                   2
                  
                  | 
                 
                  
                   $772,500
                  
                  | 
                 
                  
                   2
                  
                  | 
                 
                  
                   38
                  
                  | 
                 
                  
                   97.0%
                  
                  | 
                
                
                 | 
                  
                   Englemount
                  
                  | 
                 
                  
                   1
                  
                  | 
                 
                  
                   $755,000
                  
                  | 
                 
                  
                   1
                  
                  | 
                 
                  
                   49
                  
                  | 
                 
                  
                   99.0%
                  
                  | 
                
                
                 | 
                  
                   Forest Hill North
                  
                  | 
                 
                  
                   1
                  
                  | 
                 
                  
                   $730,000
                  
                  | 
                 
                  
                   0
                  
                  | 
                 
                  
                   35
                  
                  | 
                 
                  
                   99.0%
                  
                  | 
                
                
                 | 
                  
                   Lawrence Park South
                  
                  | 
                 
                  
                   0
                  
                  | 
                 
                  
                   $0
                  
                  | 
                 
                  
                   1
                  
                  | 
                 
                  
                   0
                  
                  | 
                 
                  
                   0.0%
                  
                  | 


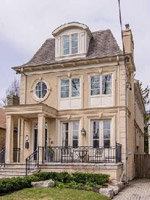
               First quarter of 2015 was busy in North Toronto. Most sales were of detached houses, and of these the only neighbourhood where the average sale price was lower than average listing price was Englemount. Even there, however, the average price of a detached home was well above one million.
              
              
               The busiest streets in North Toronto, where the largest number of houses have been sold in the first quarter of 2015, were: Melrose, with 9 listings sold, Delaraine and St. Germain with 8 sales each, and Lytton, Cranbrooke, Briar Hill and Woburn with 5 sales each.
              
              
               At the end of the first quarter of this year the supply of listings in North Toronto was 23.5% lower than at the same time last year. Please visit again to see the report on real estate activity in the second quarter.