December 2014 Toronto Real Estate Statistics
Active MLS property listings declined in December below levels we have seen since 2010, and were lower by 10.4% on a year-over-year basis. New listings and sales were almost equal - 4448 properties were listed, 4446 sold. The sales were up by 9.6%, and the average time required to sell a listing was down by 3.0%.
In the fourth quarter of 2014 listing inventory was consistently lower than in the previous four years. The low inventory, particularly in the low rise sector, resulted in bidding wars. Many of the listings set up time to review offers. 16.4% of freehold listings were sold above asking price in all of the GTA area - 11.2% in the 905 area and 32.1% in the City of Toronto.
Average price for all types of properties
in the GTA
was $556,602 - that represents an 7.0% increase on a year-over-year basis, and a 3.7% drop from the November average of $577,936.
Prices for detached houses
in the 905 area
went up by 6.6% to $668,063, for semi-detached by 9.9% to $451,314, and for townhouses by 9.4% to 420,105. Condominium apartment prices in the 905 area increased by 2.2% to $300,352. All these increases are measured on a year-over-year basis.
Again on a year-over-year basis
in the City of Toronto
: Sales of detached houses went substantially up, by 17.1%, while the average price was $934,039 (an increase of 8.0%); 5.9% fewer semi-detached houses were sold, with average price
down by 4.4%
to $615,794; townhouse sales increased by 1.8%, and the average price went up by 5.9% to $474,874; and sales of condo apartments were up by 16.1%, while the average price increased by 5.4% to $387,612.
The highest increase in price in all housing types was for semi-detached houses in the 905 area: TREB recorded a price increase there of 9.9%.
Listings in the City of Toronto took, on average, 31 days to sell - 2 days less than in December 2013. The average ratio of selling to listing price was 99% in the City and 98% in the GTA. The highest average sale to list price ratio, at 106%, was again recorded in E01 TREB district, followed by 103% in W01 and E08. The shortest average time required to sell a listing, 12 days, was reported for E06 district. The next shortest time, 13 days, was reported for district E01. The longest average time, 54 days, was recorded in C09.
In the City of Toronto
, the highest percentage paid over asking in December was 136%, for a small 1 bedroom bungalow requiring renovation, at Yonge and Sheppard. The highest dollar amount over list price ($314,000) was paid for a bungalow in Leaside, being sold in original condition. 75 condos (or 8%) and 231 freehold houses (32.1%) were sold over asking price in December.
In Historical Perspective:
-
Buyers have adjusted to the stricter mortgage lending guidelines, and, seeing no downturn in the house values, are returning to the market.
-
Mortgage rates are low, and we expect them to remain low into 2015. It is harder to get a mortgage with the new lending guidelines, but borrowing for home purchase still remains affordable.
-
Real estate market is driven by supply and demand. Listing inventory has been below the recent years levels, and sale numbers are higher. The buyers are competing for existing listings, and the prices are strong.
-
Inflation is low at 2.0%, and unemployment in Toronto dropped slightly from 7.9% to 7.8%.
We encourage you to view
video presentations by Jason Mercer
, TREB senior manager of market analysis.
To see last month real estate activity figures please visit
Our Blog
.
Interestings stats on sales of freehold homes in the City of Toronto:

The following graphs illustrate the performance of Toronto real estate market since 2008:
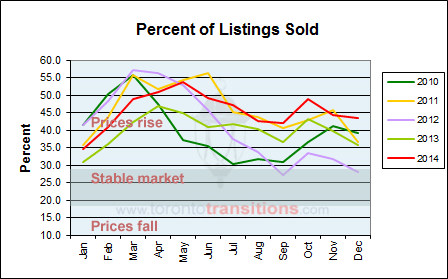
The graph above illustrates the main attribute of a real estate market - the relation, in percent, between listings sold each month and all available listings at the end of that month. A typical stable market, with buyers able to negotiate purchase prices, but, at the same time sellers able to sell their homes or condos, is when the proportion of sold to available listings is between 18% and 28%.
In the last 5 years the only two times when the market was stable were in September and December 2012.

As you can see on this graph, Toronto real estate prices follow the typical yearly trend. Average prices change with the general real estate price trend, but depend on the type of properties selling at any given time. Unusual changes in the typical seasonal trend may reflect a changing market conditions.
In 2014 the average prices have been higher, but still followed the typical yearly trend.

It is typical for the number of MLS listings to start low at the beginning of the year, as few sellers opt to market their property over the holidays. In February and March more listings become available, with the number of available listings usually peaking in May, to decrease over the summer months, rise again in September, and fall in November - December.
While the volume of listings changes seasonally and generally follows a typical trend, the higher it goes, the less pressure there is on the real estate prices. In December the number of available listings again fell below the levels seen since 2010.

Since the beginning of 2011, real estate listings in Toronto were selling, on average, within one month. If a property takes longer than the average to sell, the reason is either too high a listing price, poor condition of the house, or inadequate access for showing it. In November in the GTA listings were selling, on average, in 32 days. Within the City limits, the average time on the market for all types of properties was 31 days, detached homes took 27 days on average, semi-detached required 21 days, condominium townhouses took 29 days, and condo apartments - 36 days.
Following tables illustrate sales of freehold homes (not including condo apartments and condo townhouses) in Toronto since the beginning of 2014:
In January:
|
Area
|
number of sales
|
100% of list
|
over 100% of list
|
% of homes sold over asking
|
|
Central
|
250
|
22
|
72
|
28.8%
|
|
East
|
269
|
24
|
105
|
39.0%
|
|
West
|
214
|
17
|
57
|
26.6%
|
In February:
|
Area
|
number of sales
|
100% of list
|
over 100% of list
|
% of homes sold over asking
|
|
Central
|
362
|
34
|
179
|
49.4%
|
|
East
|
395
|
44
|
219
|
55.4%
|
|
West
|
288
|
36
|
110
|
38.2%
|
In March:
|
Area
|
number of sales
|
100% of list
|
over 100% of list
|
% of homes sold over asking
|
|
Central
|
483
|
47
|
229
|
47.4%
|
|
East
|
653
|
63
|
344
|
52.7%
|
|
West
|
463
|
43
|
216
|
46.6%
|
In April:
|
Area
|
number of sales
|
100% of list
|
over 100% of list
|
% of homes sold over asking
|
|
Central
|
617
|
54
|
266
|
43.1%
|
|
East
|
753
|
77
|
452
|
60.0%
|
|
West
|
561
|
62
|
248
|
44.2%
|
In May:
|
Area
|
number of sales
|
100% of list
|
over 100% of list
|
% of homes sold over asking
|
|
Central
|
735
|
67
|
337
|
45.8%
|
|
East
|
868
|
92
|
478
|
55.1%
|
|
West
|
698
|
87
|
288
|
41.3%
|
In June:
|
Area
|
number of sales
|
100% of list
|
over 100% of list
|
% of homes sold over asking
|
|
Central
|
630
|
66
|
258
|
41.0%
|
|
East
|
790
|
93
|
415
|
52.5%
|
|
West
|
613
|
61
|
261
|
42.6%
|
In July:
|
Area
|
number of sales
|
100% of list
|
over 100% of list
|
% of homes sold over asking
|
|
Central
|
471
|
55
|
159
|
33.8%
|
|
East
|
620
|
66
|
273
|
44.0%
|
|
West
|
499
|
49
|
157
|
31.5%
|
In August:
|
Area
|
number of sales
|
100% of list
|
over 100% of list
|
% of homes sold over asking
|
|
Central
|
320
|
24
|
99
|
30.9%
|
|
East
|
496
|
54
|
200
|
40.3%
|
|
West
|
333
|
25
|
101
|
30.3%
|
In September:
|
Area
|
number of sales
|
100% of list
|
over 100% of list
|
% of homes sold over asking
|
|
Central
|
507
|
62
|
210
|
41.4%
|
|
East
|
646
|
52
|
321
|
49.7%
|
|
West
|
496
|
45
|
179
|
36.1%
|
In October:
|
Area
|
number of sales
|
100% of list
|
over 100% of list
|
% of homes sold over asking
|
|
Central
|
567
|
67
|
214
|
37.7%
|
|
East
|
668
|
69
|
281
|
42.1%
|
|
West
|
558
|
45
|
188
|
33.7%
|
In November:
|
Area
|
number of sales
|
100% of list
|
over 100% of list
|
% of homes sold over asking
|
|
Central
|
429
|
45
|
130
|
30.3%
|
|
East
|
533
|
52
|
215
|
40.3%
|
|
West
|
386
|
51
|
110
|
28.5%
|
In December:
|
Area
|
number of sales
|
100% of list
|
over 100% of list
|
% of homes sold over asking
|
|
Central
|
195
|
14
|
52
|
26.7%
|
|
East
|
280
|
29
|
112
|
40.0%
|
|
West
|
244
|
20
|
67
|
27.5%
|
If you are interested in statistics from a particular neighbourhood, or street, please call or e-mail us, and we will be happy to prepare the information for you.
For information on real estate conditions in Toronto in the past, please visit our
2010 report
,
2012 Market Conditions
,
2011 Market Conditions
and
2013 Market Conditions
for comparison.


")